


Flooded areas
1- Processing of information
One
of
the
main
factors
involved
in
the
flood-vegetation
association
relationship
is
the
flood
height.
It
is
possible
to
modelise
the
flooded
areas
for
different
flood-heights
on
the
Mopti
flood
gauge
by
assigning
to
each
of
the
14,535
vegetation
units
its
average
flood
depth.
In
such
a
model,
"intergrade
mosaics"
are
problematical.
We
therefore
decided
to
consider
that
an
intergrade
mosaic,
for
example
BP/VB,
whose
constituent
associations
are
set
at
flood
level
7
for
BP
(flood
depth
between
4
m
and
2.8
m)
and
at
level
6
for
VB
(flood
depth
(between
2.8
m
and
1.5
m),
was
to
be
assigned
a
composite
level
76
(flood
depth
between
4
m
and
1.5
m).
In
the
calculation
of
flooded
areas,
it
is
always
possible
to
“decompose”
the
composite
levels
by
allocating
a
share
of
the
area
to
each
of
the
component
levels.
Thus
for
a
mosaic
at
level
76
such
as
BP/VB,
we
can
by
convention
allocate
half
of
the
area
of
the
unit
to
BP,
therefore
at
level
7,
and
the
other
half
to
VB,
at
level
6.
If
the
mosaic
spans
over
a
stronger
gradient,
for
example
a
mosaic
at
level
53,
a
third
of
the
area
is
attributed
to
level
5,
another
third
to
level
4
and
the
last
third
to
level
3,
since
an
area
bearing
a
mosaic
at
level
53
cannot
physically
pass
from
level
3
to
level
5
without
having
a
share
of
its
area
in
intermediate
level
4.
However,
while
it
is
possible
to
decompose
the
mosaic
composition
by
following
these
set
rules
in
a
somewhat
arbitrary
but
plausible
way,
it
is
very
difficult
or
even
impossible
to
assign
a
precise
spatial
location
to
each
of
the
components
(see
the
method
described
in
detail
in
Table
1A and summarized in Table 1, which can be downloaded)
Table 1: Flooded areas by levels after mosaic decomposition
The total area of the study is 2,229,950 ha
The
preceding
table
establishes
a
first
"model"
of
potentially
floodable
areas
in
relation
to
different
levels
of
flood
depth.
We
must
first
define
the
expression
"potentially
floodable
areas"
we
have
chosen
to
use
instead
of
the
simpler
"flooded
areas".
This
comes
from
the
fact
that,
in
the
model,
when
each
of
the
conditions
of
the
flood
depth
–
namely
flood
levels
other
than
level
1
–
is
successively
reached,
all
the
component
vegetation
associations
characterised
by
that
“average”
flooding
level
are
assumed
to
be
flooded.
However,
we
can
only
refer
to
potential
flooding
because
the
model
treats
each
vegetation
unit
as
an
independent
entity.
As
a
result,
the
effects
of
topographic
thresholds
which
would
prevent
a
basin
from
being
flooded,
even
if
the
flood
levels
corresponding
to
the
vegetation
associations
it
contains
are
reached,
are
not
and
cannot
be
taken
into
account.
One
can
only
think
that
the
presence
of
these
specific
vegetation
associations
at
this
precise
location
indicates
that
the
spot
is
usually
flooded
under
the
conditions
described by the model, though without any certainty.
Besides,
the
relationship
between
vegetation
associations
and
flood
height
is
based
on
a
single
flood
gauge:
that
of
Mopti,
which
serves
as
a
reference.
This
assumes
that
the
so-called
reference
flood
is
also
valid
for
the
other
gauges
in
the
Delta:
Ke
Macina
at
the
entry
of
the
Niger
River
into
the
Delta,
Beneny
Kegni
or
Sofara
on
the
Bani
River,
and
Akka
at
the
exit
of
the
Debo
lake.
To
define
the
corresponding
reference
floods
for
these
three
gauges,
we
relied
on
the
work
of
J.P.
Lamagat
"Analyse
de
la
vitesse
de
propagation
des
crues,
application
à
la
prévision
des
crues
et
des
étiages"
,
Orstom,
1983.
This
work
makes
it
possible
to
define
reference
floods
for
each
of
those
three
gauges
corresponding
to
different
flood
heights
as
measured
in
Mopti,
but,
as
we
will
see
later, "real" floods rarely correspond to reference floods.
This
also
leads
us
to
reflect
on
the
meaning
of
the
“zero”
reference,
which
marks
the
limit
between
flooded
and
non-flooded
vegetation
areas.
It
is
defined
as
the
maximum
flood
height
most
regularly
reached
and
its
correspondence
was
established
with
a
flood
height
of
660
cm
at
the
Mopti
gauge.
The
relationship
between
the
“zero”
reference
and
vegetation
associations
–
under
the
conditions
of
validation
of
multivariate
floristic
profile/state
of
ecological
variables
analyses
–
therefore
applies,
regardless
of
which
location
is
being
considered
in
the
Delta.
However,
this
zero
flood,
other
than
at
Mopti
–
where
it
corresponds
to
an
altitude
of
267.20
m
–
as
well
as
at
the
three
other
reference
stations
(Ke
Macina,
Sofara,
Akka),
cannot
be
attached
to
a
precise
altitude
everywhere
else
in
the
Delta.
To
move
from
a
relative
model,
calibrated
with
respect
to
this
“zero”,
to
a
topographic
model,
it
would
first
be
necessary
to
know
the
relation
uniting
“zero”
and
altitude
at
every
single
point
of
the
Delta.
As
a
first
approximation,
we
can
assume
that
“zero”
represents
the
trace
in
space
of
the
surface
generated
by
the
maximum
reference
flood
wave.
This
surface
is
probably
complex
corresponding
to
the
period
of
slack
between
the
end
of
the
flood
and
the
beginning
of
the
recession,
when
the
slope of the flow is at its lowest. We will later see how to try to solve this problem.
According
to
table
n°1,
the
potenrially
floodable
area
corresponding
to
the
reference
flood
as
defined
previously
(660cm
at
the
Mopti
gauge)
covers
1,820,289
ha,
including
the
Farimaké
area
and
the
areas
initially
flooded
first
by
run-off
then
by
the
flood.
The
second
lesson
to
be
derived
from
this
table
is
show
sensitive
the
Delta
proves
to
be
to
small
variations
in
the
water
heights.
Between
660
cm
and
600
cm,
potentially
flooded
areas
decrease
by
7%
to
9%
for
every
loss
of
10cm
in
water
height.
Below
600cm
at
Mopti,
however,
there
seems
to
be
a
sharp
shift
in
the
regression
pattern,
with
a
less
than
3%
loss
in
flooded
areas
for
each
loss
of
10
cm
in
water
height.
This
suggests
a
very
theoretical
profile
for
the
inner
Delta,
considered
as
a
single
entity
–
which
it
obviously
is
not.
Its
higher
part
appears
to
have
a
weak
cross-slope,
which
makes
it
very
sensitive
to
fairly
small
variations
in
water
heights.
Beyond
level
4, however, deep basins with steeper cross-slopes are therefore less sensitive to such variations.
2- Flood mapping: the CRUE3 layer
CRUE3
layer
is
derived
from
VEG4
by
copying
and
creating
specific
items:
H_0,
H_10,
H_30
...Among
the
ecological
variables,
two
were
selectively
chosen:
soil
texture,
which
has
been
briefly
dealt
with
in
the
preceding
part,
and
flood
heights
or
depths.
•SIGLE (fr:Sigle): is directly derived from VEG4 and matches each vegetation association with a geographical unit.
•LEVEL
(fr:niveau):
concerns
the
flood
level
of
the
vegetation
association.
A
number
between
1
and
7
is
ascribed
to
each
vegetation
association,
8
being
reserved
for
open
water.
(see
table
n°3
page
39
:
the
relationship
between
vegetal
associations,
water
heights and the Mopti gauge measurements)
The
mosaics
are
represented
by
a
two-digit
number
in
reference
to
their
component
associations.
Thus
BP/VB,
respectively
belonging
to
levels
7
and
6
will
be
coded
76,
while
O/VOR
will
be
coded
55
since
its
components
both
belong
to
level
5.
For
the
sake of simplicity, single vegetation associations are coded from 11 to 77, with 80 reserved for MB and 90 for open water.
•HIGH
(fr:Profond):
translates
the
LEVEL
item
into
water
depth.
The
detail
of
those
heights
is
discussed
page
XXX.
Let
us
just
say
that
it
corresponds
to
the
bottom
level
of
the
corresponding
water
range
for
single
vegetation
formations,
and
the
average
one
for
the
mosaics.
Thus
B
will
be
given
a
depth
of
-2.80m
in
keeping
with
level
66
and
B/VOR
will
be
given
a
depth
of
-2.15
cm,
in
keeping
with
level
65.
Non-flooded
vegetation
formations
(TA
to
TS)
are
conventionally
given
a
0
depth,
so
that
P/TA,
at
level
21,
will be given a depth of 0.05m (average between -0.1m and 0m)
As
we
are
going
to
see,
such
conventions
required
by
cartography
tend
to
maximise
flooded
areas
by
comparison
to
table
1,
which was reached by de-composing the mosaics
•H_0
to
H_280:
these
fields
derive
directly
from
the
HIGH
item.
They
are
of
the
yes/no
type
and
contain
the
following
numerical values:
•0 when the area is not flooded under the conditions of the field H_0, H_10, etc.
•1 when the area is flooded under the conditions of field H_0, or H_10 etc.
•2 when the area is first flooded by run-off (PAN, PAR, PAS, PAM type formations) under field conditions H_0, H_10, etc.
•
The same reasoning applies to items H_30, H_60, H_150, H_280.
•
A
convention
is
set
for
mosaics
including
associations
PAN,
PAR
or
PAS,
PAM.
When
one
of
the
two
associations
is
non-
flooded
as
for
PAN/TA
for
example,
the
mosaic
is
considered
first
flooded
by
run-off,
therefore
coded
2.
When
the
other
association
within
the
mosaic
is
a
flooded
type
–
as
for
PAN/ZB
for
example
–
the
river
flood
prevails
on
the
run-off
flood
and
the mosaic is coded 1. This scenario only concerns a very small number of polygons.
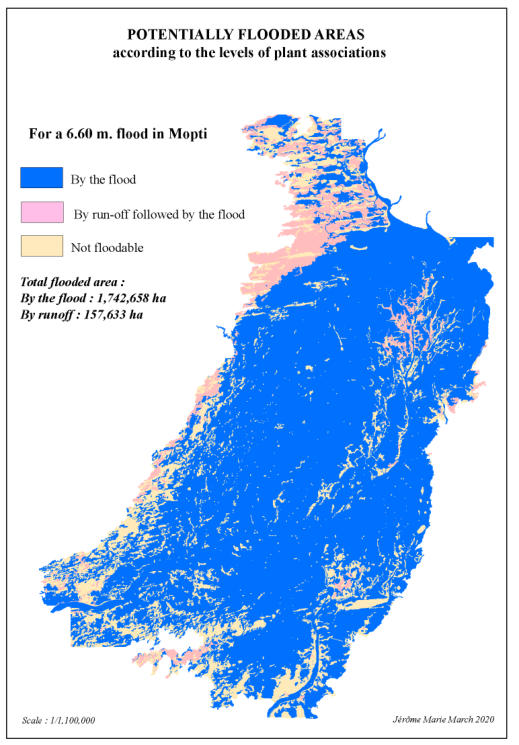
•
For
a
flood
reaching
660
cm,
the
floodable
surfaces
occupy
almost
the
entire
Delta.
The
Farimaké
in
the
northwest
is
largely
flooded
by
run-off
first,
with
the
flood
coming
in
late
(November-December.
Inside
the
basin,
the
spaces
that
remain
exposed
are
mainly located in the following areas
-first,
along
a
double
string
of
"toggere"
forming
an
alignment
running
parallel
to
the
main
course
of
the
Niger
river;
from
Koubaye to the south (at the latitude of Mopti), this turns into a large tree-shape area around Dialloubé, south of Lake Débo.
-second, east of Djenné, the erg of Femaye, along the Bani and the highlands of southern Sébéra.
-third, near Diafarabé, south of Niger and west of the Diaka, between the defluent and the western margin.
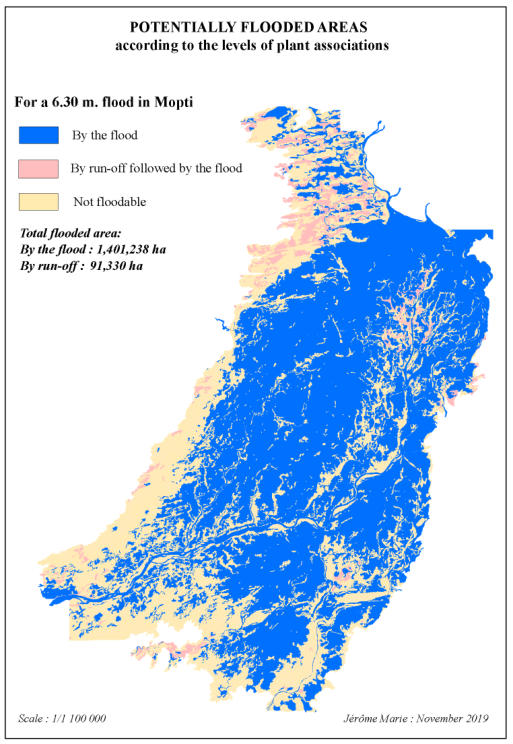
•
For
a
flood
reaching
630
cm,
the
western
margin
of
the
flood
recedes
and
approaches
Ténenkou.
The
"
Togge
"
occupy
a
larger
area
and
in
the
southern
part,
the
water
table
in
Djenné
is
already
visibly
beginning
to
separate
into
a
northern
basin
and
a
southern basin.
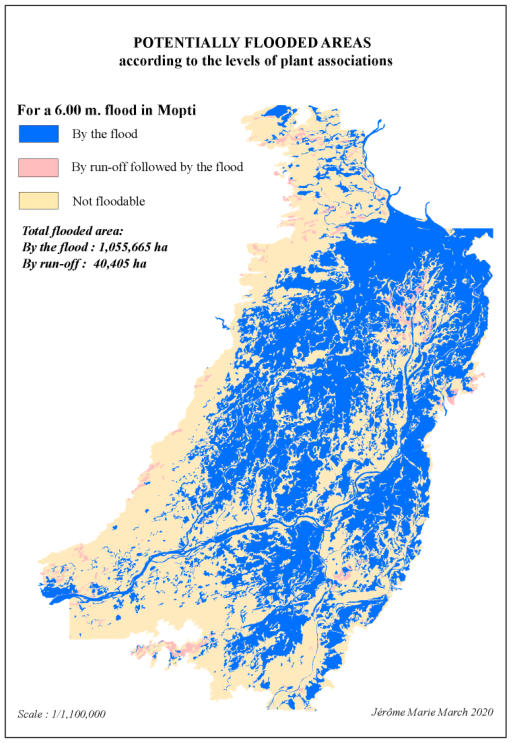
•
For
a
flood
reaching
600
cm,
the
highlands
in
the
center-east
of
the
Delta
form
a
continuous
area
from
Kouakourou
north
of
Dialloubé.
The
fragmentation
of
the
water
table
which
completely
covered
the
bowl
at
660
cm
is
now
well
marked.
To
the
west,
the
flood
continues
to
stretch
massively
from
Ténenkou
to
Lake
Walado;
to
the
east,
it
is
still
continuous
from
the
Bani-Niger
mesopotamia,
continues
along
the
right
bank
of
the
Niger
from
Mopti
to
Konna
before
joining
Lake
Débo
in
the
north.
In
the
southern
part
of
the
Delta,
the
separation
of
the
basins
to
the
right
of
Djenné
is
almost
complete
and
the
highlands
of
Diafarabé
are out of water, except for a string of pools south of the river.
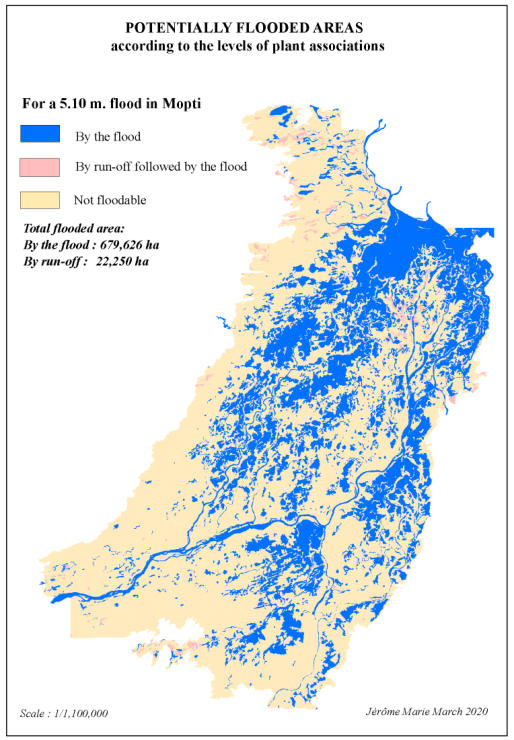
•
For
a
flood
reaching
510
cm,
the
majority
of
the
Delta
basin
is
no
longer
flooded
and
the
highly
fragmented
water
surfaces
occupy only the heart of the deep basins which constitute the resistant core of the inner Delta
Table 2: Areas potentially flooded by levels of flood height
As
a
conclusion,
the
model
we
have
sketched
allows
us
to
calculate
and
map
out
potentially
flooded
areas
for
each
class
of
water-heights.
The
presence
of
intergraded
mosaics
makes
it
necessary
to
define
conventions
by
which
the
latter
are
allocated
to
specific
level,
so
that
numerical
results
will
differ
between
tables
1
and
2,
with
the
cartographic
method
overestimating
the
areas
concerned.
Nevertheless,
the
cartography
allows
us
to
catch
a
glimpse
of
the
way
in
which
the
inner
Delta
is
structured,
with
deep
basins
(see
move
form
600
cm
to
510
cm)
whose
precise
contours,
contents
and
boundaries
cannot
be
identified.
This
matches
the
conclusions
derived
from
the
analysis
of
the
map
of
vegetation
formations
which
shows
how
very
subtle
combinations
allow
the
Delta’s
structure
to
display
several
distinct
vegetation
landscapes.
We
shall
attempt
to
further
establish
the
Delta’s
structure
by
moving
from
a
discrete
model
to
a
continuous
one
relying
on
matrix
data,
allowing
us
to
move
to
a
3D
model
of
the
potentially
flooded
areas.
We
shall
also
endeavour
to
derive
a
Digital
Elevation
Model
of
the
Delta
from
it,
after
setting
the
relevant
altitudes
for the reference flood.

Flooded areas


* Level 8 corresponds to water (Niger, Bani, Lakes….)
**Level
2
corresponds
to
a
10
cm
layer
(0
-
10
cm),
level
3
to
two
slices
(10
-
30
cm),
level
4
to
three
layers
(30
-
60
cm),
level
5
to
nine
layers
(60
-
150
cm),
level
6
to
thirteen
layers(150
-
280
cm)
and
level
7
to
twelve
layers
(280
-
400
cm).
The
height
of
380
cm
has
never
been
observed
in Mopti as the maximum height of an annual flood, the lowest recorded value was 440 cm in 1984
.
Download
